Assignment 1: Identify the project scope and objective of the given problem:
a. College automation system.
Scope: Automate various administrative and academic tasks of a college, including:
- Student registration and management
- Faculty/staff data and schedule management
- Course management and enrollment
- Attendance tracking and record-keeping
- Fee management and payment processing
- Library management
- Exam and result processing
- Communication platform for students, faculty, and staff
Objective:
- Reduce paperwork and manual processes
- Improve efficiency and accuracy in data management
- Enhance data accessibility and communication
- Offer seamless online services for students and faculty
- Streamline administrative tasks for staff
Imagine: A central platform where students can register, enroll in courses, check grades, and access resources. Faculty can manage schedules, record attendance, and communicate with students. Administration can handle fees, generate reports, and track academic progress. All in one system, accessible anytime, anywhere.
b. Banking Management System:
- Scope: Automate and manage various banking operations, including:
- Account opening and maintenance
- Customer data management
- Deposit and withdrawal transactions
- Loan processing and repayments
- Fund transfers and bill payments
- Investment management and financial advisory
- Security and fraud prevention
- Mobile banking and online banking services
Objective:
- Enhance customer experience through fast and convenient services
- Increase efficiency and accuracy in financial transactions
- Reduce operational costs and paper usage
- Offer personalized financial products and services
- Improve risk management and security
- Streamline communication and interaction with customers
Imagine: A user-friendly platform where customers can manage their accounts, pay bills, invest in funds, and track transactions. Secure mobile banking allows on-the-go access. The system analyzes data to offer personalized financial solutions and detect fraudulent activities. All under one roof, secure and efficient.
The specific scope and objectives of each system will depend on the needs and limitations of the college or bank implementing it.
Assignment 2: Develop software requirements specifications for (1 a.) and (1 b.) problems.
SRS is like a blueprint for building software. It outlines what the software needs to do, how it should work, and what it should look like. It’s like giving clear instructions to a builder so they know exactly what to build.
Key parts of an SRS:
1. Introduction:
- Purpose of the system
- Users of the system
- Intended environment (where it’ll be used)
2. Overall Description:
- General features and functions (like a summary of the blueprint)
- Major constraints (like building codes or zoning laws)
3. Specific Requirements:
- Functional requirements: what the system must do (like rooms, walls, windows)
- Non-functional requirements: how well it should do it (like quality of materials, safety features)
College Automation System SRS:
– Functional requirements:
- Register students, manage courses, track attendance
- Process exams and results, manage fees
- Generate reports, and communicate with students/faculty/staff – Non-functional requirements:
- User-friendly interface
- Secure data storage
- Reliable performance
- Compatibility with devices and browsers
Banking Management System SRS:
– Functional requirements:
- Open and manage accounts, process transactions
- Offer loans, manage investments
- Provide online and mobile banking services
- Generate financial reports – Non-functional requirements:
- High-level security
- 24/7 availability
- Real-time transaction processing
- Scalability to handle growth
- Compliance with banking regulations
Remember:
- SRS is a crucial document for developers and stakeholders.
- It ensures everyone understands what the software should do.
- It’s like a contract before building a house.
- Clarity and detail are key!
Assignment 3: Develop UML Use case model for a problem.
Imagine a Use Case model as a visual map of who uses a system and what they do with it. It’s like drawing a diagram of a house, showing the rooms and who uses them for what activities.
Key elements of a Use Case model:
1. Actors: Stick figures representing people or things interacting with the system (like homeowners, guests, or pets in a house).
2. Use Cases: Ovals representing actions or tasks the system can perform (like cooking in the kitchen, sleeping in the bedroom, or watching TV in the living room).
3. Relationships: Lines showing how actors and use cases connect (like doors leading to rooms, or people moving between spaces).
Example: Use a Case model for a Library Management System
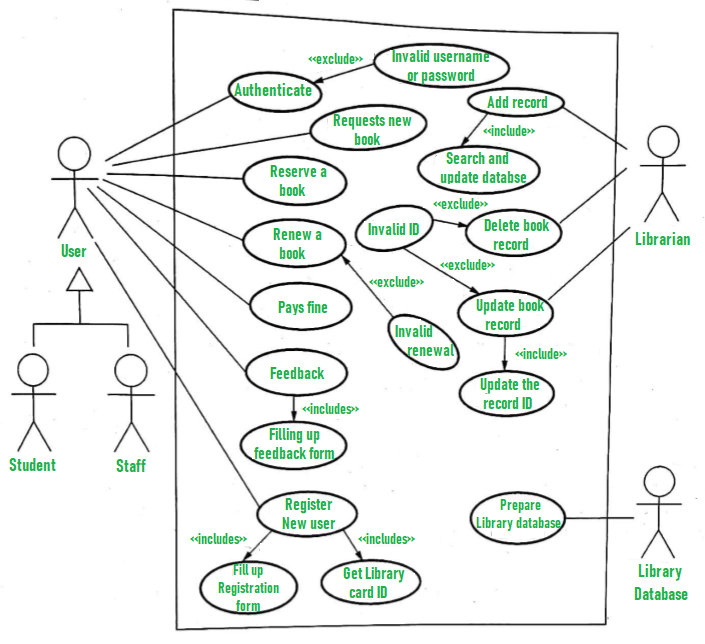
Actors:
- Librarian
- Member
- System Administrator
Use Cases:
- Check out book
- Return book
- Search for book
- Renew membership
- Add new book
- Manage user accounts
Relationships:
- The librarian can perform all use cases.
- Members can check out, return, search for books, and renew their membership.
- System Administrator can manage user accounts and add new books.
Benefits of Use Case Models:
- Clarify system requirements and functionality
- Identify potential issues early in development
- Improve communication among stakeholders
- Help plan testing and validation
- Serve as a reference for future maintenance
Remember:
- Use Case models are not detailed designs, but rather high-level overviews.
- They’re often created early in the development process to guide planning.
- They can be refined and updated as the project progresses.
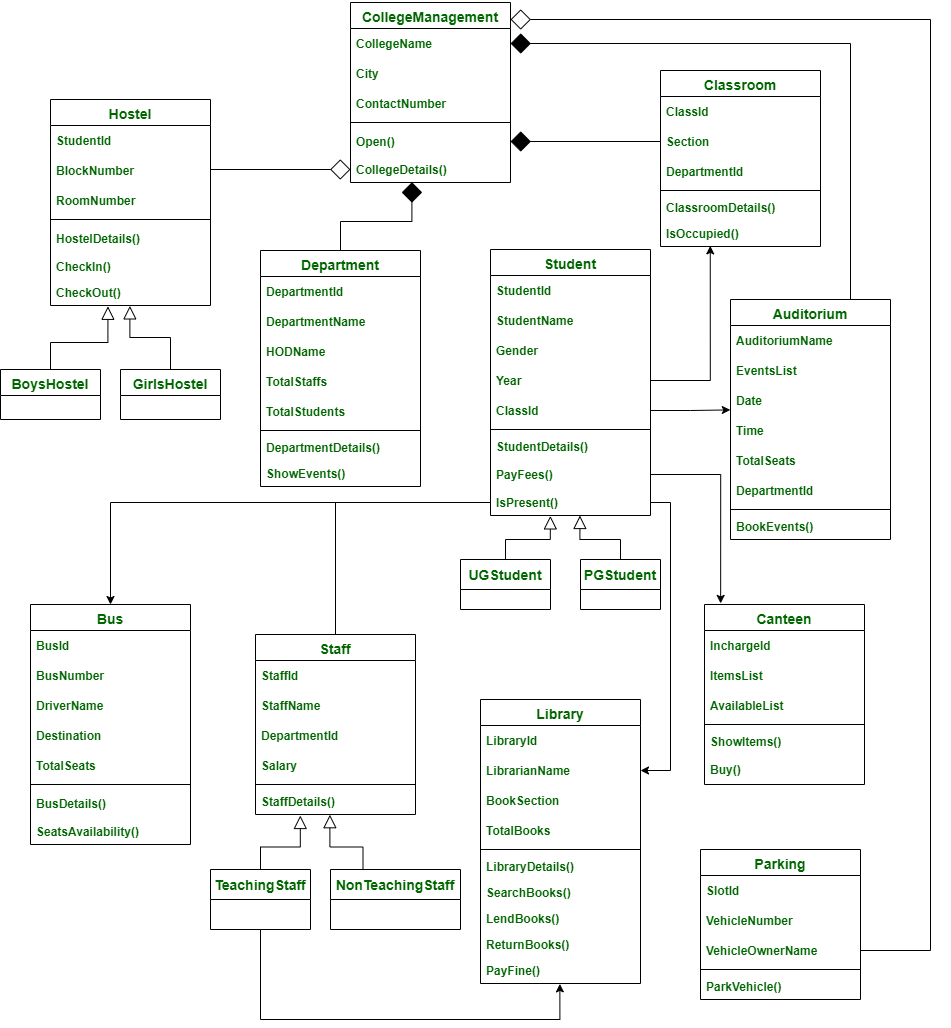
Assignment 4: Develop Class diagrams
- College Management – This class is the overall main class of the whole system.
- Department – This class contains the details of various departments in the college.
- Student – This class is for students and it is the base class for two child classes – UGStudent and PGStudent. Since UGStudent is a Student and PGStudent is a Student
- UGStudent – This class is the child class of Student and it contains the details of UGStudent.
- PGStudent – This class is the child class of Student and it contains the details of PGStudent.
- Staff – There are two types of staff in the college. So this class is the base class of two child classes – TeachingStaff and NonTeachingStaff
- TeachingStaff – This class is the child class of Staff. Since TeachingStaff is a Staff.
- NonTeachingStaff – This class is the child class of Staff. Since NonTeachingStaff is a Staff.
- Classroom – This class contains the details of every classroom in the whole college.
- Canteen – This class is for storing Canteen details inside the college
- Library – This class contains the details of a particular library in the college
- Bus – This class contains the details of a bus along with the bus driver details
- Hostel – Hostel can be of two types. So this class is the base class of two child classes – BoysHostel and GirlsHostel.
- BoysHostel – This class is the child class of the Hostel. Since BoysHostel is a Hostel.
- GirlsHostel – This class is the child class of the Hostel. Since GirlsHostel is a Hostel.
- Parking – This class contains the details of the parking area in a college. The parking area can be used by students, staff, visitors, etc.
- Auditorium – The auditorium is a place where any events or guest lectures happens. This class contains the details of it.
Assignment 5: Represent project Scheduling of the above-mentioned projects
Steps:
- Break down tasks: Divide the project into smaller, manageable tasks (e.g., designing a database, developing a user interface, and coding different modules).
- Estimate time: Estimate the time required for each task based on complexity and resources.
Identify dependencies: Determine which tasks depend on others being completed first.
- Assign resources: Assign tasks to team members based on skills and availability.
- Create a schedule: Use a tool like a Gantt chart to visualize the timeline, task dependencies, and milestones.
- Track progress: Regularly monitor progress, make adjustments as needed, and communicate updates to stakeholders.
Common scheduling techniques:
- Gantt charts: Visualize tasks, durations, and dependencies.
- PERT charts: Focus on task dependencies and critical paths.
- Critical path analysis: Identify the sequence of tasks that must be completed on time to avoid project delays.
Scheduling considerations:
- Available resources: Ensure sufficient personnel and equipment.
- Task complexity: Account for varying levels of difficulty.
- Risk factors: Identify potential challenges and plan contingencies.
- Stakeholder expectations: Manage expectations and communicate progress effectively.
Assignment 6: Use any model for estimating the effort, schedule, and cost of a software project.
Estimating effort, schedule, and cost for software projects requires specific models considering project characteristics.
Here are some common models to consider:
1. Function Point Analysis (FPA): Measures project size based on the functionality delivered. It counts specific user functions and data elements, and then applies weightings for complexity. FPA tools exist to assist in calculation.
2. COCOMO Model: Considers project size (lines of code) along with influencing factors like team experience and project maturity. Different versions (Basic, Intermediate, and Detailed) are available, requiring varying levels of project information.
3. Three-Point Estimation: Uses optimistic, pessimistic, and most likely estimates for tasks to build a statistically robust schedule and cost estimation. It accounts for uncertainty and potential variations in task duration.
Applying these models to your College Management System:
- FPA: Identify user functions like student registration, course enrollment, attendance recording, etc. Count functions and data elements, apply complexity weights, and use an FPA tool to estimate effort in person-months.
- COCOMO: Estimate the total lines of code required for the system’s different modules. Choose a COCOMO version based on available project information and adjust for team experience and project maturity. The model generates effort, schedule, and cost estimates.
- Three-Point Estimation: Break down project tasks into smaller units (design, development, testing) and estimate their durations for each scenario (optimistic, pessimistic, most likely). Calculate averages and standard deviations to build a realistic time and cost estimation for the project.
Remember:
- These models provide approximate estimates, not guarantees.
- Accuracy relies on accurate project information and input values.
- Consider adapting models and incorporating your domain knowledge for better results.
- Always factor in contingencies for risks and uncertainties.
Additional Points:
- Cost is a function of effort, team rates, infrastructure, and other factors. Utilize your organization’s cost estimation practices for calculating project costs.
- Scheduling your project involves identifying task dependencies and allocating resources effectively. Utilize scheduling tools like Gantt charts based on your chosen estimation model.
Assignment 7: Develop DFD model (level-0, level-1 DFD and Data dictionary) of the project
Imagine a DFD as a map of how information flows through a system, like a blueprint for a house’s plumbing and electrical wiring.
Key elements:
- Processes: Represent actions or tasks the system performs, like rooms in a house where work happens.
- Data flows: Show how information moves between processes and other elements, like pipes or wires carrying data.
- Data stores: Represent where data is kept, like storage tanks or batteries for information.
- External entities: Represent people or systems that interact with the system, like visitors or neighbors.
Levels:
- Level 0 (context diagram): Shows the whole system as a single process and its connections to external entities, like a house’s overall plumbing layout.
- Level 1: Break down the system into major sub-processes and data stores, like zooming in on individual rooms and their plumbing fixtures.
- Lower levels: Further detail complex processes, like focusing on individual pipes and connections.
Key points:
- DFDs focus on data flow, not control flow (who decides what happens).
- They are hierarchical, like zooming in on a map.
- They are used in system analysis and design to visualize information flow and identify potential issues.
- They help stakeholders understand how a system works and communicate requirements.
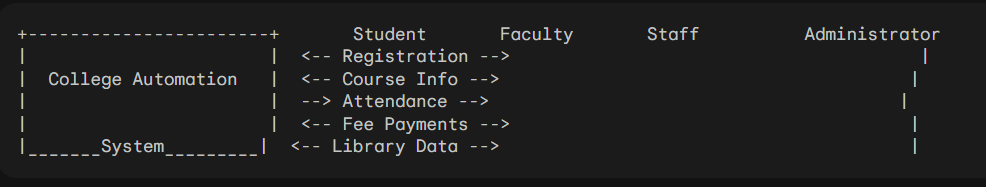
Here’s a description of DFD levels with simplified diagrams for the College Automation System:
Level-0 DFD (Context Diagram):
- Single process: Represent the entire system as a single process bubble labeled “College Automation System”.
- External entities: Represent users/systems interacting with the system:
- Students
- Faculty
- Staff
- Administrator
- Data flows: Show data exchanges between the system and external entities, connected by arrows:
- Student Registration Data
- Course Information
- Attendance Records
- Fee Payments
- Library Management Data
Simplified Diagram:
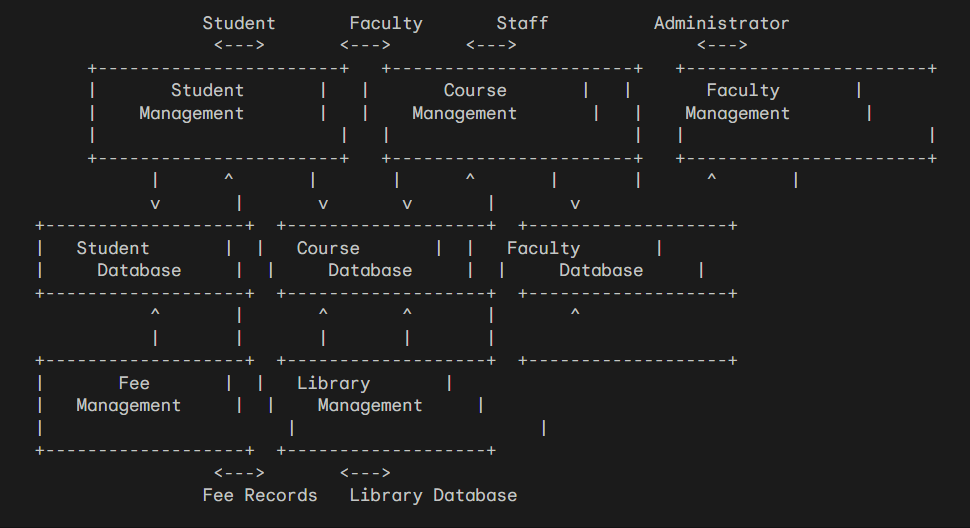
Level-1 DFD:
- Decompose the Level-0 process into major sub-processes:
- Student Management
- Course Management
- Faculty Management
- Fee Management
- Library Management
- Data stores: Represent data storage areas:
- Student Database
- Course Database
- Faculty Database
- Fee Records
- Library Database
- Data flows: Show data flows between processes, external entities, and data stores, connected by arrows.
Simplified Diagram:
Data Dictionary:
(Example Entries)
- Student ID: Unique identifier for each student (numeric)
- Student Name: Student’s full name (text)
- Course Code: Unique identifier for each course (alphanumeric)
- Course Name: Name of the course (text)
- Faculty ID: Unique identifier for each faculty member (numeric)
- Faculty Name: Faculty member’s full name (text)
- Fee Amount: Amount due for a particular fee (numeric)
- Book Title: Title of a book in the library (text)
Assignment 8: Develop sequence diagram
Sequence Diagrams Explained:
Imagine a sequence diagram as a visual script of how objects interact within a system to accomplish a task, like a detailed scene in a movie screenplay.
Key elements:
- Objects (or Lifelines): Represent entities involved in the interaction, like actors on a stage.
- Messages: Arrows between objects representing communication or actions, like lines of dialogue or actions in a script.
- Activation Boxes: Show when an object is actively performing a task, like an actor delivering their lines.
- Time: Flows vertically, top to bottom, like scenes progressing in a movie.
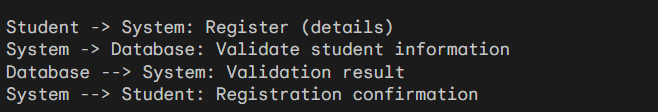
Developing a Sequence Diagram for College Automation System:
- Identify Scenario: Choose a specific use case or feature to model, such as student registration or fee payment.
- List Objects: Identify the primary objects involved in the interaction (e.g., Student, System, Database).
- Determine Message Sequence: Map out the step-by-step exchange of messages between objects, considering:
- Which object initiates the interaction?
- What actions or requests are sent?
- What responses or data are returned?
Draw the Diagram:
- Arrange objects vertically, with time flowing downward.
- Connect objects with arrows representing messages, labeled with actions or data.
- Show activation boxes when objects are performing tasks.
Example (simplified) Sequence Diagram for Student Registration:
Remember:
- Sequence diagrams focus on object interactions and message sequencing, not data flow.
- They are valuable for understanding system behavior, identifying potential issues, and communicating design ideas.
- Create multiple diagrams for different scenarios to capture system dynamics comprehensively.
Assignment 9: Develop a Structured design for the DFD model developed
What is Structured Design? Imagine you have a blueprint for a house (DFD Model), but you need to translate it into specific building blocks and their connections (Structured Design). This involves:
- Module Creation: Breaking down the system into smaller, manageable units called modules. These modules correspond to processes in the DFD.
- Module Hierarchy: Organizing modules into groups based on their relationships and dependencies.
- Module Communication: Defining how modules interact with each other through data structures and interfaces.
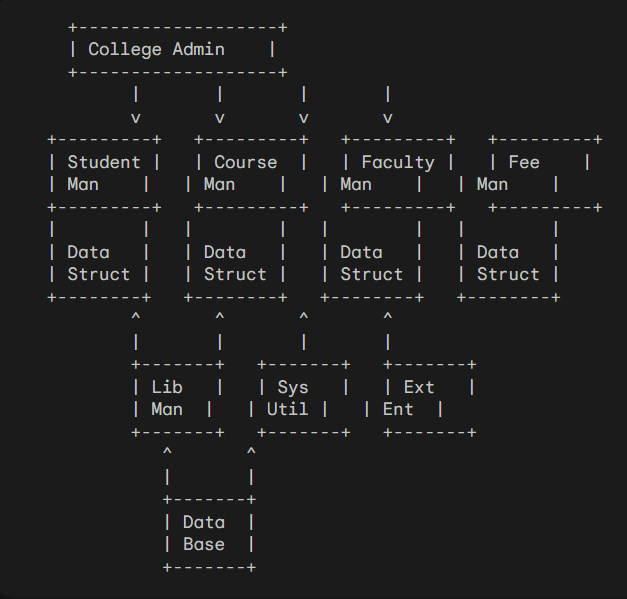
Simplified Design for College Automation System:
Modules:
- Student Management Module
- Course Management Module
- Faculty Management Module
- Fee Management Module
- Library Management Module
Module Hierarchy:
All modules report to a central “College Administration Module” that handles overall system coordination and data access.
Module Communication:
- Modules exchange data through defined data structures like student records, course information, fee reports, etc.
- Modules communicate requests and responses through clearly defined interfaces, ensuring compatibility and avoiding direct code dependencies.
Simplified Diagram:
Key Points:
- Structured design promotes modularity, maintainability, and code reusability.
- It provides a clear roadmap for translating DFD concepts into implementable software components.
Assignment 10: Develop the waterfall model, prototype model and spiral model of the product
1. Waterfall Model: Imagine building a house sequentially, step-by-step: planning, design, foundation, walls, roof, finishing touches.
Process:
- Define detailed requirements upfront.
- Complete each phase (analysis, design, development, testing) in sequence before moving to the next.
- Changes are difficult and costly after a phase is done.
College Automation System Application:
- Clearly define all system functionalities and features before development begins.
- Develop software modules one by one, following a strict sequence.
- Testing occurs at the end of the entire development process.
2. Prototype Model: Imagine building a miniature model of the house first, testing it with users, and then refining the actual house based on feedback.
Process:
- Quickly build a simplified working model of the system.
- Get user feedback early and iterate on the prototype based on their input.
- Refine the prototype until it satisfies user needs and requirements.
College Automation System Application:
- Create a basic version of the system with core functionalities.
- Let students, faculty, and staff test and provide feedback on the prototype.
- Incorporate feedback into the final design and development of the system.
3. Spiral Model: Imagine building a house by combining the benefits of sequential planning with continuous progress and risk management.
Process:
- Iteratively combine waterfall-like phases (planning, design, development, testing) with risk assessment and feedback.
- Each iteration delivers working functionalities while mitigating identified risks.
- The model adjusts its focus and adapts to changing needs as the project progresses.
College Automation System Application:
- Divide the system into smaller modules and develop them iteratively.
- At each iteration, assess potential risks and address them before proceeding.
- Gather user feedback continuously and incorporate it into subsequent iterations.
Comparing the Models:
- Waterfall: Structured, predictable, good for well-defined requirements, but inflexible to changes.
- Prototype: Adaptable, reduces risk of user dissatisfaction, but needs good planning and resource allocation.
- Spiral: Balanced approach, manages risks early, but can be complex and require experienced project management.
Choosing the Right Model: The best model depends on project factors like:
- Project size and complexity
- Requirements clarity and expected changes
- Team experience and available resources
- Importance of user feedback and early testing
For the College Automation System, where requirements are likely to evolve with user feedback, a prototype or spiral model might be more suitable than a strict waterfall approach.
Assignment 11: Explain with reason which model is best suited for the project
Determining the best software development model for the College Automation System requires considering the project’s unique characteristics and priorities. While each model has its advantages, here’s why a Prototype or Spiral Model is most likely the best fit compared to the Waterfall Model:
Waterfall Model:
- Pros: Structured and predictable, ideal for well-defined requirements.
- Cons: Inflexible to changes, costly to backtrack if requirements evolve, risky for complex projects with evolving needs.
Prototype Model:
- Pros: Adaptable, reduces user dissatisfaction through early feedback, allows iterative progress on core functionalities.
- Cons: Requires strong planning and resource allocation, might not prioritize overall structure and documentation.
Spiral Model:
- Pros: Combines sequential planning with risk management and continuous feedback, manages risks early, and balances flexibility with structure.
- Cons: Can be complex to manage, and requires experienced project management.
College Automation System Considerations:
- Evolving needs: User feedback and changing requirements are likely through development.
- Complex system: Multiple modules and functionalities need to be integrated.
- User involvement: Early and ongoing user feedback is crucial for system success.
Why Prototype or Spiral Model:
Both the Prototype and Spiral models address the College Automation System’s key needs:
- Adaptability: They allow incorporating user feedback and adjusting requirements throughout development.
- Risk management: Both models identify and address potential issues early, minimizing costly rework.
- User involvement: They prioritize early user interaction and testing, leading to a system that better meets user needs.
Choosing between Prototype and Spiral:
- Prototype: If rapid development and user feedback are top priorities, the Prototype model might be faster to kick off.
- Spiral: If the project is highly complex and requires structured risk management, the Spiral model might provide better control and planning.
Assignment 12: Develop a working protocol of any of two problem
College Automation System: Working Protocol Explained: Imagine a college running like a well-oiled machine, thanks to a smart automation system. Here’s a simplified explanation of how it might work:
Users and Roles:
- Students: Register, select courses, view grades, access study materials, and pay fees.
- Faculty: Create and manage courses, upload lectures, conduct online assessments, and track student progress.
- Staff: Manage admissions, handle fee payments, update records, and generate reports.
- Admin: Oversee the entire system, grant access, configure settings, and ensure data security.
Main Modules and Functionalities:
- Admission Management: Register new students, manage applications, verify documents, and automate fee payments.
- Course Management: Create and schedule courses, manage faculty assignments, upload learning materials, and enable online registration.
- Attendance Management: Record student attendance through various methods (biometric, RFID card, etc.), and generate reports for faculty and parents.
- Assessment Management: Conduct online quizzes, exams, and assignments, automatically grade submissions, and provide feedback to students.
- Fee Management: Track fee payments, send reminders, offer online payment options, and generate financial reports.
- Library Management: Maintain a digital catalog of books and resources, enable online borrowing and reservations, and track availability.
- Communication Management: Send notifications and announcements to users, facilitate online forums and discussions, and enable instant messaging.
- Reporting and Analytics: Generate reports on attendance, grades, financial transactions, and usage patterns, and provide valuable insights for decision-making.
How it Works:
- User Login: Each user logs in with their unique credentials for secure access.
- Main Dashboard: Users see a personalized dashboard with relevant information and quick access to frequently used features.
- Module Access: Each user has access to specific modules based on their role and permissions.
- Data Exchange: Modules interact with each other, sharing data seamlessly to ensure everything is up-to-date.
- Notifications: Users receive relevant notifications for important events, deadlines, and updates.
- Reporting and Analytics: Authorized users can access detailed reports and insights to make informed decisions.
Benefits:
- Increased Efficiency: Automates manual tasks, saves time, and reduces paperwork.
- Improved Accessibility: Provides 24/7 access to services for students, faculty, and staff.
- Enhanced Communication: Facilitates information sharing and collaboration between all stakeholders.
- Better Data Management: Centralized data storage ensures accuracy and accessibility.
- Data-Driven Decisions: Provides valuable insights for improving curriculum, resources, and services.
Challenges:
- Initial Investment: Setting up the system requires upfront costs for software, hardware, and implementation.
- Data Security: Robust security measures are needed to protect sensitive student and financial data.
- User Adoption: Encouraging users to embrace the new system and maximize its benefits.
Conclusion: A College Automation System, while requiring careful planning and implementation, can revolutionize the way colleges operate, offering efficiency, transparency, and a better experience for all users.
Assignment 13: Use LOC, FP and Cyclomatic Complexity Metric of above-mentioned problem
Estimating LOC, FP, and Cyclomatic Complexity for the College Automation System you described requires more specific details about the system implementation. However, I can offer some general estimations and considerations:
Lines of Code (LOC):
- The overall LOC will depend significantly on the chosen programming language, development framework, and desired feature set.
- A basic system with the core modules you mentioned could range from 50,000 to 100,000 LOC, while a more complex and feature-rich system might require 150,000 to 250,000 LOC or even more.
Function Points (FP):
- Estimating FP requires analyzing the system’s functionality from a user perspective, counting data elements and user interface elements.
- A basic College Automation System could have an FP range of 50 to 100 FP, while a more complex system with various integrations and advanced features might reach 150 to 250 FP or higher.
Cyclomatic Complexity (CC):
- CC measures the complexity of individual code modules based on decision points and control flow paths.
- Maintaining low CC (ideally between 1 and 5) within modules promotes clean and maintainable code.
- The overall CC of the system depends on the individual module structures and coding practices.
Important Note:
- These are just rough estimates based on typical range for similar systems.
- The actual values will vary greatly depending on your specific implementations, chosen technologies, and level of detail within each module.
For a more accurate estimation:
- Define the specific features and functionalities for each module in detail.
- Choose the development language and framework you plan to use.
- Use estimation tools or consult with experienced software developers familiar with the chosen technology.
Assignment 14. Find the Maintainability Index and Reusability Index of the above-mentioned problem
Determining the Maintainability Index (MI) and Reusability Index (RI) of the College Automation System
Maintainability Index (MI):
- Factors influencing MI include:
- Code complexity (e.g., Cyclomatic Complexity)
- Module size and structure
- Code documentation and clarity
- Naming conventions and consistency
- Use of error handling and exception management
- Tools like Halstead and McCabe metrics can be used to analyze code and generate MI scores.
- For a system like College Automation, a well-designed and documented system with moderate complexity could achieve an MI in the range of 0.6 to 0.7. However, complex and poorly documented code might yield an MI as low as 0.3 to 0.4.
Reusability Index (RI):
- Factors influencing RI include:
- Code modularity and separation of concerns
- Use of abstraction and polymorphism
- Generalization of functionality and minimal dependencies
- Code organization and reusability potential
- Techniques like design patterns and object-oriented programming principles can enhance RI.
- For a well-modularized College Automation System with reusable components, an RI in the range of 0.5 to 0.6 could be achievable. However, tightly coupled and non-generalizable code might have an RI as low as 0.2 to 0.3.
Remember:
- These are just estimations based on typical ranges for similar systems.
- The actual MI and RI will vary greatly depending on your specific code implementation, chosen technologies, and coding practices.
For a more accurate estimation:
- Analyze your code structure and complexity using appropriate tools or metrics.
- Evaluate the level of code modularity and reusability potential.
- Consider external factors like coding standards and team practices.
Maintaining high MI and RI:
- Focus on modularity, clear code structure, and proper documentation.
- Apply object-oriented principles and reusable design patterns.
- Use consistent naming conventions and ensure error handling robustness.
- Conduct code reviews and continuously improve code quality.
By prioritizing these aspects, you can develop a College Automation System with better maintainability and reusability, leading to easier maintenance, adaptation, and potential extensions in the future.
Assignment 15. Using any Case Tool find number of statements, depth and complexity of the prototype
1. Choose a CASE Tool:
- Consider factors:
- Compatibility with your programming language and development environment
- Features offered (e.g., code analysis, metrics generation, visualization)
- Pricing and licensing options
- Popular options:
- Visual Paradigm
- Enterprise Architect
- Rational Rose
- StarUML
- Understand
- SonarQube
2. Import Prototype Code:
- Follow tool-specific instructions:
- Load the prototype’s source code files into the CASE tool
- The tool will automatically parse and analyze the code’s structure
3. Generate Metrics:
- Locate the metrics generation feature:
- Find options for calculating lines of code (LOC), depth, and complexity metrics
- Common metrics include:
- LOC: Total lines of code in the prototype
- Cyclomatic Complexity (McCabe’s metric): Number of independent paths through the code
- Nesting Depth: Maximum nesting level of control structures (e.g., loops, conditional statements)
4. Interpret Results:
- Understand metrics:
- LOC: Indicates prototype size and potential development effort
- Cyclomatic Complexity: Measures code’s decision paths and potential for errors
- Nesting Depth: High depth can suggest difficult-to-read and maintain code
- Compare to benchmarks:
- Assess against industry standards or project guidelines for your language and domain
Additional Recommendations:
- Manual Review: Supplement tool-generated metrics with manual code reviews to identify potential issues or areas for improvement.
- Visualization: Use CASE tool features to visualize code structure and dependencies for better understanding.
- Refactoring: If metrics reveal high complexity or depth, consider refactoring to improve code quality and maintainability.
- Involve Experienced Developers: Consult with experienced developers to interpret results and guide actions based on metrics insights.
Remember:
- CASE tools provide valuable insights, but don’t replace human judgment and expertise.
- Use metrics as guides for continuous improvement, not rigid targets.
- Focus on writing clear, well-structured code to enhance maintainability and reduce complexity from the start.